Schematic
overview of the investigation of longitudinal cancer progression
| T H E N I H C A T A L Y S T | M A Y – J U N E 2001 |
|
|
|
H O T M E T H O D SBEYOND GENOMICS TO CLINICAL PROTEOMICS:PART II: PROTEIN MICROARRAYS |
by
Cloud Paweletz, NCI, FDA |
|
|
Schematic
overview of the investigation of longitudinal cancer progression
|
In
part
one of this article we discussed
the application of surface-enhanced laser desorption mass spectrometry to
uncover disease-associated protein fingerprint patterns (The NIH Catalyst
March–April 2001). In part two, we describe the development of protein
microarrays and discuss their potential for answering basic and applied questions.
Protein Array Challenges . . .
Following the success of cDNA microarrays, protein arrays may seem straightforward. Unfortunately, the two types of molecules are vastly different, and the dynamic range required for proteomics may be a thousandfold more than for RNA transcripts.
cDNA interactions are governed by Watson–Crick base pairing, whereas protein-antibody interactions are determined by complex associations between epitopes on the target protein and the antigen-binding site on the antibody. These interactions are highly dependent on external environmental influences and hence may hinder the design and utilization of a generic protein array format. Moreover, sensitivities of individual antibody-antigen interactions depend on the relative abundance of the antigen-antibody species and the binding affinities.
This dependence is especially problematic if one considers the extremely broad range of protein concentrations that are present in living cells. For example, protein concentration differences between activated and nonactivated proteins in tissue may range from <2 logs to <6 logs in relative protein concentrations. Changes in a low-abundant protein, therefore, may be overshadowed by high-abundant proteins if these are analyzed on the same array.
Lastly, there is no PCR for proteins—so they cannot be amplified directly.
. . . And Solutions
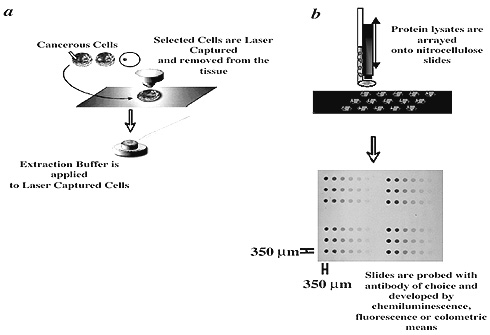
About a year ago, we set out to develop a highly quantitative and precise protein array that would enable us to study defined signaling circuits within individual cell populations of clinically relevant material. We termed the robust technology that emerged "reverse-phase protein microarray" (RPPA). RPPA combines laser-capture microdissection (LCM) and cDNA microarray technologies.
First, histopathologically relevant cell populations are microdissected and lysed in a suitable lysing buffer; then, nanoliters of that lysate are arrayed with a pin-based microarrayer onto glass-backed nitrocellulose slides at defined positions.
These applications result in spots that are 250–350 mm wide, each containing the whole cellular repertoire corresponding to a given pathologic state that has been captured. Subsequently, each slide can be probed with an antibody that can be detected by fluorescent, colorimetric, or chemiluminescent assays (see figure above).
The signal intensity of each feature is proportional to the concentration of analyte detected and therefore limited to the dynamic range of the detection method used. Thus, unlike constraints with immunohistochemical staining, it is now possible to quantify microscopic protein concentrations from one histopathologically relevant cell population to another by RPPA. To optimize the detection of each individual antibody-antigen binding pair, one arrays each cellular lysate sample in a miniature dilution curve and thus determines an optimized dynamic range for that particular antibody-antigen interaction.
RPPA differs from a complementary type of protein array, the antibody arrays—also developed by our laboratory for microdissected samples. Antibody arrays immobilize hundreds of antibodies on a solid matrix. The current limitation of antibody arrays is that the input protein sample must be labeled in a manner that does not interfere with the antibody-binding site.
In contrast, RPPA does not require labeling of the sample protein, yet has high sensitivity and precision. RPPA is best used to answer questions about specific candidate molecules and the state of critical, previously identified, nodes in the cellular circuitry. To wit:
![]() Is the candidate molecule actually present or altered in the human disease lesion?
Is the candidate molecule actually present or altered in the human disease lesion?
![]() Is the candidate target within a pathway that can be verified to be aberrant
in the diseased tissue chosen for treatment?
Is the candidate target within a pathway that can be verified to be aberrant
in the diseased tissue chosen for treatment?
Validation
As part of our format validation, we used this novel type of protein microarray to analyze the state of growth and apoptosis pathways at the invasion front of prostatic cancer in human tissue. We conducted extensive studies that demonstrated the linearity and reproducibility of RPPA.
Within and between slides, there was an excellent correlation between protein concentration and signal output (r2 = 0.973 and r2 = 0.952).
We analyzed phospho ERK and phospho Akt protein concentrations in patient-matched normal, PIN (premalignant), invasive carcinoma, and stromal cell populations and found that in every one of our 10 longitudinal cases, phospho ERK protein values were suppressed during the evolution of progression (P <0.02), whereas phospho Akt protein values concomitantly increased (P < 0.048).
We validated the specificity of these results by western analyses of microdissected cells procured from the same cases.
Activation of Akt, a substrate of PI3K, may promote cell motility and survival as the invading cancer cells leave the gland and invade the stroma. Concomitantly, the suppression of ERK will prevent cell-cycle blockade and may thus deregulate cell proliferation.
Conclusion
The activated (phosphorylated) state of signal pathway checkpoints in vivo cannot be ascertained from gene expression alone. Nevertheless, the state of such pathways is a key determinant of the diseased cellular physiology and in evaluating therapeutic efficacy. To realize this goal, we are using RPPA to study changes in phosphorylated proteins and entire pathways in patient biopsy samples before, during, and after treatment. These clinical trials are being conducted within NCI. The clinical trial investigators are Elise Kohn and Susan Bates.
Application of proteomics
to clinical trial monitoring may lead to patient-tailored therapy in which combinations
of drugs are designed to match the proteomic profile of that patient’s
disease—the target will be the entire pathway itself. ![]()
References
1. L.A. Liotta and E.F. Petricoin. "Molecular profiling of cancer." Nat. Genet. Rev. 1: 48–56 (2000).
2. B.B. Haab, M.J. Maitreya, and P.O. Brown. "Protein microarrays for highly parallel detection and quantitation of specific proteins and antibodies in complex solutions." Genome Biology 2: 1–13 (2001).
3. C.P. Paweletz, L. Charboneau, V.E., Bichsel, et al. "Reverse phase protein microarrays which capture disease progression show activation of pro-survival pathways at the cancer invasion front." Oncogene, 20: 1981–1989 (2001).
4. V. Knezevic, C. Leethanakul, V.E. Bichsel, et al. "Proteomic profiling of HNSCC progression." Proteomics. In press.
5. J. Boguslavsky. "Protein chips still growing." Drug Discovery & Dev., March, S25–S26 (2001).
_____________________________________________________________________________
NOTE: Mention of
a specific product in The NIH Catalyst does not imply endorsement. Failure
to mention
other products does not imply any opinion, positive or negative, about the products.
_____________________________________________________________________________
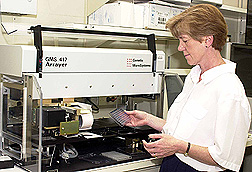
Microdissection and Cellular Lysate Arraying. Microdissection is carried out under careful direct pathological examination (as previously described; see The NIH Catalyst, November–December 1997, "Hot Methods") using a Pixcell 200 Laser Capture Microdissection system (Arcturus Engineering, Mountain View, Calif). Before microdissection, paraffin-embedded tissue sections are deparaffinized by completely submersing the slide in Xylene three times for six minutes each. The sections are then stained according to a modified hematoxylin and eosin staining protocol that calls for treatment of tissue sections sequentially in 100%, 95%, and 70% ethanol, HPLC-grade water, hematoxylin (Sigma, St. Louis, Mo.), HPLC-grade water, blueing solution (Sigma, St. Louis), 70%, 95%, and 100% ethanol for 20 seconds each, and final dehydration in SubX. All staining baths contain 10 mmol CompleteTM (Boehringer Mannheim, Germany) protease inhibitors. Between 500 and 3,000 LCM shots (approximately 2,500 and 15,000 cells, respectively) are acquired per investigated foci. Microdissected cells are lysed in 30 mL of lysing buffer containing 1:1 mixture of 2 X SDS electrophoresis buffer (125 mM Tris pH 6.8, 4% SDS, 10% glycerol, 2% b-mercaptoethanol) and Tissue Protein Extraction Reagent (Pierce, Rockford, Ill.) for 2 hours at 70 oC. After cell lysis, samples are boiled between 3 and 5 minutes each, and 3 nL of the lysate are arrayed with a pin and ring GMSE 470 microarrayer (Affymetrix, Santa Clara, Calif.) using a 500-mm pin onto nitrocellulose slides with a glass backing (Schleicher and Schuell, Keene, N.H.). Spatial densities of 980 spots/slide and greater can easily be accommodated on a 20-mm X 30-mm slide. Image and Statistics Analyses. Stained slides are scanned on a UMAX scanner with Adobe PhotoShop 5.5 at a resolution of 600 dpi for analyses. Scanned images (saved as "tif" files) are analyzed with ImageQuant (Molecular Dynamics, Sunnyvale, Calif.), using the "histogram" option as background correction of choice. The Wilcoxon rank-sum test is used to test group differences in the adjusted mean protein expression between histologically normal epithelium, PIN, stroma, and invasive lesions. Two-sided statistical
tests are used throughout; P-values < 0.05 are considered to be statistically
significant. All analyses are performed using the statistical software
package STATA (STATA Corporation, College
Station, Texas). Linear regression analysis and graphing are carried out
using Origin 4.1. |